


Talent acquisition leaders face pressure to justify headcount, defend sourcing spend, and quantify hiring velocity. The real problem is not a lack of talent acquisition metrics data. Inconsistent definitions, fragmented tracking, and delayed reporting make existing data unusable. This guide covers the core talent acquisition metrics you need to track, how to calculate each one, 2026 benchmarks, and the reporting structure that turns hiring data into decisions, not just dashboards.
The Three Categories of Talent Acquisition Metrics
Talent acquisition metrics fall into three categories: operational metrics that track speed and efficiency, financial metrics that track cost and return, and quality metrics that track hire performance and retention.
Focusing on one category distorts performance. Speed alone reduces quality. Cost control alone slows hiring. You need to track all three and analyze how changes in one metric affect the others.
OPERATIONAL METRICS
1. Time-to-fill
What it measures: The total number of days between requisition approval and offer acceptance.
Formula:

2026 Benchmark: SHRM data places the average time to fill across industries at approximately 42-48 days, with variation by role. High-volume roles fill in 14 to 30 days. Technical and senior roles often extend to 60 to 90 days or more.[1]
How to track: Record the exact date each requisition is approved and the date the offer is accepted. In Manatal, the Hiring Velocity report calculates this automatically when both fields are consistently logged. Filter by role type and department to avoid aggregating averages that hide role-specific delays.
What breaks it: Backdated requisitions, inconsistent approval date logging, and offer tracking done outside the ATS.
How to improve: Pre-build interview panels before a role opens to cut approval lag. Standardize interview stages so scheduling delays are eliminated by process design. Monitor stage dwell time weekly to catch bottlenecks early.
2. Time-to-hire
What it measures: The number of days between a candidate entering your pipeline and accepting an offer.
Formula:

2026 Benchmark: Time-to-hire averages range from 24 to 45 days depending on industry and seniority, with most roles falling between 30 and 44 days.[2][3]
How to track: Define a single point of pipeline entry across your team, typically when a candidate is added to the ATS or completes an initial screen. Inconsistent entry-point definitions are the most common cause of inflated or deflated benchmarks. In Manatal, stage-level pipeline reports show exactly how long candidates spend at each stage, making the source of delay immediately visible.
What breaks it: Inconsistent entry-point definitions across recruiters and interviewer scheduling delays that get absorbed into the metric without being isolated.
How to improve: Set response SLAs for each stage and hold hiring managers to them. Monitor stage dwell time to identify where candidates wait longest, not only the total figure.
The speed-quality tradeoff: Time to hire and quality of hire are often in tension. Compressing the process to hit a speed target lowers screening rigor and produces mis-hires that cost more to replace than the time saved. Manatal's AI-driven candidate scoring ranks candidates before recruiters engage them, so teams move faster without reducing evaluation quality.
{{cta}}
3. Offer Acceptance Rate
What it measures: The percentage of offers extended that candidates accept.
Formula:
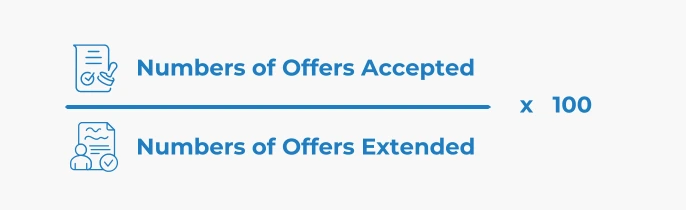
2026 Benchmark: Most organizations target an 85 to 90% acceptance rate, though the right threshold varies by industry and role. Rates below 75% typically signal compensation misalignment, process-related candidate drop-off, or a competing offer problem that surfaced too late.
How to track: Divide accepted offers by total offers extended over a defined period. Track at the role and department level to identify patterns. In Manatal, offer outcomes are logged directly within the pipeline, so this metric reflects actual performance rather than partial data from off-system negotiations.
What breaks it: Offers negotiated outside the ATS, incomplete offer outcome logging, and delayed offers that allow competing processes to close first.
How to improve: Shorten the time between the final interview and offer delivery. Align on compensation range with hiring managers before the role opens. Track rejection reasons systematically. Candidates declining for compensation, role clarity, or process length each require a different response.
4. Pipeline Coverage Ratio
What it measures: The ratio of active candidates in your pipeline to open requisitions. It tells you whether you have enough candidate flow to meet hiring targets.
Formula:

2026 Benchmark: A 3:1 to 5:1 ratio is considered healthy. For specialist or competitive roles, aim for 5:1 to 8:1 to maintain quality and account for drop-offs. Industry observations (including from Gartner trends) suggest this shift reflects the need for more thorough evaluation as candidate quality becomes harder to assess. What this really means is you need more candidates in play to make confident decisions. Set higher pipeline coverage targets upfront for these roles and plan for deeper evaluation, not faster filtering.[4][5]
How to track: Review at the requisition level, not in aggregate. An aggregate ratio of 4:1 masks individual requisitions sitting at 1:1 that are effectively stalled.
What breaks it: Treating pipeline coverage as a reporting metric instead of a live management signal. Monthly reviews mean sourcing shortfalls on individual roles are not visible until they have already delayed the hire.
How to improve: Set pipeline coverage targets before each role opens. Start active sourcing when coverage drops below the threshold, not when the role is already running late.
5. Requisition Aging
What it measures: The number of days a requisition has been open without an accepted offer. It identifies stalling roles before they become critical delays.
Formula:

2026 Benchmark: Any open requisition that exceeds 1.5 times your target time to fill should be flagged for review. A requisition at twice the target without an accepted offer typically requires a sourcing strategy change, a role scope review, or both.
How to track: Review weekly, as requisition aging is a leading indicator. It signals when the time to fill will deteriorate before the metric reflects the problem. In Manatal, open requisition reports filter by aging to surface stalled roles immediately.
What breaks it: Reviewing aging in a monthly report. By the time a stalled role appears in a monthly review, the delay is already significant.
How to improve: Assign aging thresholds in advance. At 50% of target time to fill with no screened candidates, trigger a sourcing review. At 100%, escalate to the TA manager with a revised sourcing plan within 48 hours.
6. Interview-to-offer ratio
What it measures: The number of interviews conducted for each offer extended. It evaluates screening effectiveness and process efficiency.
Formula:
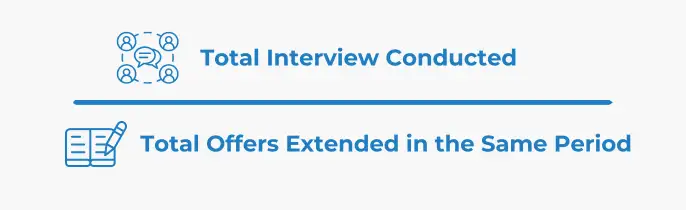
2026 Benchmark: A ratio of 3:1 to 5:1 is typical for most roles. Ratios above 8:1 suggest screening criteria are too broad, interview stages are redundant, or evaluation consistency is low. Ratios below 2:1 suggest insufficient screening rigor, which tends to correlate with declining quality of hire scores.[6]
How to track: Track at the role type and department level. The ratio appropriate for a high-volume customer service role is not appropriate for a senior technical hire.
What breaks it: Counting informal conversations or recruiter screens inconsistently, which distorts the ratio.
How to improve: Use structured interview scorecards to improve evaluation consistency. Greater consistency reduces the number of interviews needed to reach a confident hiring decision.
FINANCIAL METRICS
7. Cost Per Hire
What it measures: The total cost to make a single hire, across all internal and external resources allocated to the process.
Formula:
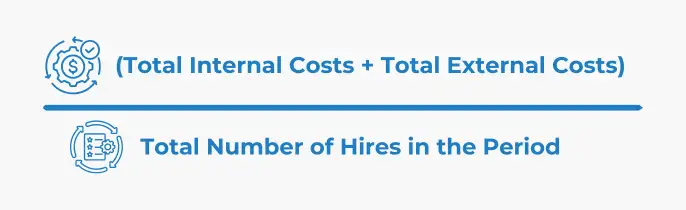
Note: Internal costs include recruiter time, hiring manager interview hours, and HR administration. External costs include job board spend, agency fees, assessment tools, and employer branding investment.
2026 Benchmark: According to the Juicebox 2026 Cost Per Hire Analysis, the average cost per hire for non-executive roles is approximately $4,800 (per recent SHRM-aligned data), while entry-level positions typically range from $1,500 to $3,000. For specialist and senior roles, costs can range from $10,000 to $28,000, including specialized vetting and agency fees. However, the report emphasizes that the most effective strategy is to move beyond national averages and instead track internal CPH by source channel and role type over rolling quarters to measure true recruitment efficiency.[7]
This cost per hire calculator uses the SHRM formula and benchmarks the results against the average cost.
How to track: Maintain cost data at the role level. Internal costs are consistently underestimated because recruiter time is rarely logged against specific requisitions. External costs are often tracked in finance systems disconnected from the ATS, making spend-to-outcome analysis require manual reconciliation.
What breaks it: Untracked internal time, fragmented cost data across finance and recruiting systems, and agency fees logged after the hire closes rather than against the pipeline record.
How to improve: Reduce dependency on paid channels by improving talent database utilization. Review the cost by source quarterly to identify which channels produce hires most efficiently. A channel producing 20 hires at $800 each outperforms one producing 30 hires at $2,000 each.
8. Sourcing Channel ROI
What it measures. : The return on investment for each sourcing channel, measured by the ratio of hires produced to cost and time invested.
Formula (simplified):

Note: For a fuller picture, weight by quality of hire and time to fill per channel, not by hire volume alone. Compare across channels to identify relative efficiency.
2026 Benchmark: According to LinkedIn Talent Solutions, employee referral programs continue to deliver the highest quality-adjusted ROI, averaging a 29-day time-to-hire and Quality of Hire scores 25% above other channels. While job boards generate the highest applicant volume, they suffer from the lowest conversion rates due to increased application noise.[8]
How to track: Tag candidates at the point of entry with a standardized source label. In Manatal, sourcing channel reports track conversion rate and hire volume by source automatically. Attribution accuracy degrades when source tags are backfilled or left blank, so enforce structured tagging at the point of entry.
What breaks it: Missing source tags, aggregating all job board spend under a single category, and tracking only volume without quality and speed per source.
How to improve: Shift investment toward channels with high conversion rates and low time to hire. High volume from a channel converting at 0.3% costs more than lower volume converting at 3%. Review channel performance quarterly against a rolling 90-day window to smooth out single-month anomalies.
QUALITY METRICS
9. Quality of Hire
What it measures: A composite score of post-hire performance and alignment against role expectations within the first 90 days.
Formula:
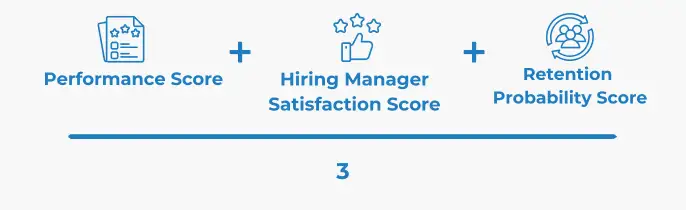
Rate each component on a 1 to 5 scale at the 90-day mark.
2026 Benchmark: There is no universal benchmark. The scoring framework varies by organization. Track internal consistency: a rising average quality score over rolling quarters means your sourcing, screening, and evaluation process is improving. A declining score means speed, volume, or process changes are compromising hiring outcomes.
How to track: Run structured hiring manager check-ins at 30, 60, and 90 days using a consistent set of questions: role clarity, performance against expectations, skill gaps identified, cultural alignment, and retention likelihood. Score each on a 1 to 5 scale and average. In Manatal, feedback is logged directly in candidate records using structured notes and candidate tags, enabling later analysis by source, recruiter, role type, or interview method.
What breaks it: Subjective or inconsistent evaluation criteria, informal check-ins that go unrecorded, and failure to correlate quality scores back to sourcing channel and interview process data.
How to improve: Standardize evaluation frameworks so quality scores are comparable across hiring managers and departments. Correlate post-hire performance with sourcing channels and structured interview outcomes to identify which inputs consistently predict high quality.
10. First-Year Retention Rate
What it measures: The percentage of new hires who remain in their role through the end of their first year.
Formula:
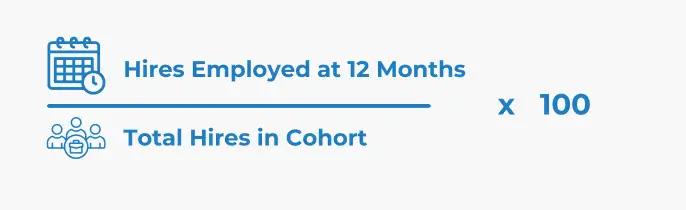
2026 Benchmark: First-year attrition averages 20 to 30% across industries, with higher rates in customer-facing, high-volume, and entry-level roles. A first-year retention rate above 80% is considered strong. Rates below 70% point to misalignment in the hiring process, onboarding, or role clarity.
How to track: Track by hire cohort (quarter or month of hire), role type, department, and source channel. Patterns in early attrition by source channel indicate whether certain channels produce candidates who perform initially but do not stay.
What breaks it: Tracking retention as a single annual figure instead of by cohort, which masks improvement or deterioration in specific departments or time periods.
How to improve: Correlate early attrition back to interview process data. If a disproportionate number of early leavers came from a specific sourcing channel or passed through a specific interview panel, treat that as a diagnostic signal. Log exit interview data against the hire record.
11. Candidate Net Promoter Score (cNPS)
What it measures: How likely candidates are to recommend your hiring process to others, regardless of whether they received an offer.
Formula:

Survey candidates who complete at least one interview. Ask: "How likely are you to recommend our hiring process to a colleague or friend?" on a 0 to 10 scale.
2026 Benchmark: According to the Starred 2026 Hiring Benchmarks Report, the current global average cNPS sits at +17. Organizations that achieve a score above 20 are considered to be in the "positive" tier, indicating a process where promoters significantly outnumber detractors. This level of performance typically suggests clear communication and timely feedback, even for rejected candidates.[9]
How to track: Send structured surveys to candidates immediately after each stage where they progress or are declined. Stage-specific cNPS data is more useful than a single end-of-process score because it identifies where the experience breaks down. In Manatal, stage-level reporting highlights where candidates drop out, which correlates with cNPS declines when both are tracked together.
What breaks it: Surveying only successful candidates, which produces artificially high scores and hides the experience of the majority of your pipeline.
How to improve: Reduce delays between stages, standardize communication touchpoints, and ensure declined candidates receive timely and clear communication.
12. Hiring Manager Satisfaction Score
What it measures: How effectively the recruiting function meets hiring managers' expectations for candidate quality, process speed, and communication.
Formula: Post-hire survey with five consistent questions rated on a 1 to 5 scale: candidate quality presented, recruiter responsiveness, process timeline, role clarity at intake, and overall satisfaction. Average the scores.
2026 Benchmark: High-performing TA functions maintain hiring manager satisfaction scores above 4.0 out of 5.0. Scores below 3.5 are an early indicator of relationship breakdown between recruiting and the business. This typically results in hiring managers bypassing TA entirely or defaulting to agency-first sourcing.
How to track: Survey hiring managers within two weeks of each hire closing using the same questions every time. Track by department and recruiter to identify patterns rather than treating the aggregate score as the only signal.
What breaks it: Infrequent surveys, too much time passing between the hire and the survey, and questions framed to produce positively biased responses.
How to improve: Use the intake meeting as a leading indicator. Hiring managers who leave intake meetings with documented requirements, agreed timelines, and defined evaluation criteria consistently score the process higher at close.
The Talent Acquisition Metrics Dashboard
A talent acquisition dashboard should be structured in layers: a primary metric tied to the current business priority, supported by metrics that explain performance, and leading indicators that forecast outcomes; this structure answers key leadership questions on hiring speed, quality, cost efficiency, and future risk. Use this Talent Acquisition Metrics Tracking Template to track inputs like source of hire, time to fill, and pipeline activity in a consistent, manual format.
Best Practices for Talent Acquisition Reports
Step 1: Audit your data collection methods.
Confirm that your talent acquisition metrics inputs are reliable before building any dashboard. Requisition dates, candidate stages, source tags, and offer outcomes must be consistently recorded across all recruiters and roles. A dashboard built on inconsistent inputs produces inconsistent outputs. Run a data quality audit across the last 90 days of hiring activity before treating any metric as reportable.
Step 2: Define your primary metric based on business priorities.
Select the primary metrics for talent acquisition that reflect what leadership is accountable for. If the organization is scaling headcount, prioritize time to fill. If cost control is the focus, prioritize cost per hire and sourcing channel ROI. Align all supporting metrics to explain movement in that primary metric.
Step 3: Standardize tracking through real-time reporting.
Replace manual tracking with an ATS that enforces structured data entry at every stage. In Manatal ATS, this happens through pipeline-based tracking where every candidate action is logged against predefined stages.
For example:
- Use Manatal Candidate Reports to track candidate flow, stage conversion rates, and time in stage. This ensures every recruiter logs candidate progress consistently.
- Use Manatal Jobs Reports to monitor requisition-level data such as time to fill and pipeline coverage, with no manual aggregation required.
Because data is captured at the point of action, metrics update in real time. This removes the lag and inconsistencies that come from spreadsheet-based tracking.
Step 4: Automate dashboard reporting for stakeholders.
Once data entry is standardized, automate reporting directly from the ATS instead of rebuilding metrics manually. In Manatal, dashboards pull live data from active pipelines, so leadership sees current performance without waiting for weekly or monthly consolidation.
For example:
- Use Manatal Hiring Performance Reports to present metrics such as time to hire, offer acceptance rate, and recruiter performance in a single view.
- Combine candidate and job-level reports to show both pipeline health (leading indicators) and hiring outcomes (lagging indicators) in the same dashboard.
This approach removes version control issues and reporting delays. What leadership sees reflects the current state of hiring, not a reconstructed snapshot from outdated data.
Reporting Talent Acquisition Metrics to the C-Suite
The most common mistake in TA reporting is relying on lagging talent acquisition metrics alone. They confirm what already happened. They do not help you manage what comes next.
Lagging metrics such as time to fill, cost per hire, and quality of hire confirm past performance. Leading metrics such as funnel conversion, pipeline coverage, cNPS, and source volume indicate whether hiring targets will be met in the next 30 to 60 days. You need both. Without leading metrics, you report history rather than managing outcomes.
For executive reporting, structure your presentation around four questions:
- Are we hiring fast enough? Show six-month trends for time to fill by department, not a single snapshot.
- Are we spending efficiently? Compare cost per hire against budget with a clear source breakdown.
- Are we hiring well? Include quality of hire by cohort and hiring manager satisfaction to show balance between speed and outcomes.
- Are we at risk? Add pipeline coverage ratio and requisition aging to highlight near-term hiring risk before it becomes a missed target.
Showing that offer acceptance rate declined because time to hire increased beyond a threshold, not because of compensation, redirects the conversation from "do we need to pay more?" to "where is the process slowing down?" That is the difference between reporting data and influencing decisions.
How Talent Acquisition Metrics Influence Each Other
Talent acquisition metrics do not work in isolation. Changes in one metric produce effects across others. Understanding those relationships prevents misdiagnosis.
- Cutting interview stages reduces time to fill and improves time to hire, but lower screening rigor reduces quality of hire scores at 90 days.
- Shifting sourcing budget from agencies to direct channels reduces cost per hire but increases time to fill in the short term.
- Declining cNPS scores lead to lower offer acceptance rates and higher first-year attrition, because candidate experience predicts early engagement.
- Improving pipeline coverage ratio reduces requisition aging and provides the buffer needed to maintain quality standards through offer declines.
- Increasing hiring manager satisfaction scores correlates with higher quality of hire, because aligned intake processes produce better-defined role requirements.
Reporting these relationships, rather than presenting individual metric values in isolation, changes how decisions get made.
When to Act on Talent Acquisition Metrics (and When to Wait)
A metric moving in the wrong direction for one week is noise. The same talent acquisition metric moving in the wrong direction for three consecutive weeks is a signal requiring a defined response.
Set action thresholds in advance rather than making judgment calls in the moment:
- Time to fill exceeds your internal target by 20% for two consecutive weeks: the recruiter reviews the stage breakdown and escalates to the TA manager.
- Offer acceptance rate declines for two consecutive months: the TA director reviews compensation benchmarking and the time between final interview and offer delivery.
- Source conversion drops below a pre-defined floor for a given channel: a sourcing strategy review starts within five business days.
- Pipeline coverage ratio drops below 3:1 on any active requisition: active sourcing starts immediately, not at the next weekly review.
- Requisition aging reaches 100% of target time to fill without an accepted offer: it escalates to the TA manager with a revised sourcing plan within 48 hours.
Pre-defined thresholds prevent overreaction to short-term fluctuations and under-reaction to real structural problems. When a metric crosses a threshold, the response protocol already exists. Whoever owns the metric executes it.
Conclusion
The TA functions that earn a strategic seat in leadership conversations are not the ones with the most data. They are the ones whose data is structured consistently enough to answer performance questions in real time, credible enough to inform resource decisions, and forward-looking enough to show where risks are emerging before they become outcomes. The next step is not finding better talent acquisition metrics data. It is structuring the data you already have so it answers the questions leadership is asking before they have to ask them.
Frequently Asked Questions
Q: What is the difference between time to fill and time to hire?
A: Time to fill measures the total days from requisition approval or job posting to offer acceptance, so it reflects the speed of the full hiring process. Time to hire measures the days from a specific candidate’s entry into the pipeline to offer acceptance, so it isolates how quickly your team moves once a candidate is identified. In Manatal, both metrics can be tracked through customizable dashboards and reports, which also show source of hire, candidate conversion, and pipeline trends.
Q: How often should talent acquisition metrics be reviewed?
A: Review velocity metrics weekly, since they change quickly and expose bottlenecks early. Review cost and quality metrics monthly, because they need enough volume to be meaningful. Manatal’s dashboard content supports this cadence, with strategic dashboards often reviewed weekly or monthly and hiring performance reports that can be run on a weekly pipeline-conversion view or a monthly source-quality view.
Q: What are the most important talent acquisition metrics for a recruitment agency?
A: For agencies, source of hire conversion rate and time to fill are usually the most commercially important because they affect placement volume, delivery speed, and margin. Quality of hire becomes more important on retained searches or roles with replacement guarantees, where post-hire outcomes matter to client retention. Manatal’s reporting and analytics can track source of hire, candidate conversion, and quality-related signals through customizable dashboards, so agencies can see which channels and pipelines actually produce results.
Q: How do you measure quality of hire without a formal performance review system?
A: Use a structured 30, 60, and 90-day hiring manager check-in, then score the same questions each time so the data stays comparable. Manatal is a good fit here because you can standardize evaluation with candidate scorecards and store structured feedback in custom fields on the candidate profile, which gives you a repeatable quality signal even without a formal performance review process.
Q: What should a talent acquisition metrics dashboard show at the executive level?
A: It should show trends, not isolated numbers. At minimum, include time to fill by department or role, cost per hire versus budget with source breakdown, quality of hire by cohort, offer acceptance rate, pipeline coverage, and requisition aging so leaders can see both current performance and near-term risk. Manatal’s customizable dashboards and reports are built for this kind of view, and its reporting suite can surface pipeline progress, source effectiveness, and real-time hiring KPIs.
Q: What is a good benchmark for cost per hire in 2026?
A: There is no single universal benchmark, because cost per hire changes a lot by role type, location, sourcing mix, and seniority. The better approach is to compare each role family against its own historical trend and review it on a monthly or quarterly basis. Manatal’s reporting dashboards and custom reports are useful here because they let you monitor cost per hire in real time and break it down by source and role, which makes benchmarking much more practical than relying on one company-wide average.
Citations
.webp)


.webp)


.webp)