


IN THIS GUIDE
- The challenge of making sense of recruitment data
- Organize your data with custom dashboards
- Pre-defined libraries vs. custom building
- Key reports you need to be tracking
- Filtering and sharing your insights
At some point, every recruitment leader faces the task of proving ROI or identifying bottlenecks within their hiring pipeline. While having data is great, sifting through data to find meaningful trends is a different story. If you are struggling to understand why your "Time to Hire" is lagging or which clients are driving the most revenue, relying on guesswork will only slow you down.
Our Advanced Reports feature unlocks insights by transforming your recruitment data into actionable intelligence. Whether you are looking for a high-level overview or granular pipeline metrics, this feature ensures you have the tools to make informed data-driven decisions with ease.
Here is how you can use Advanced Reports to optimize your workflows.
Organize Your Data with Custom Dashboards
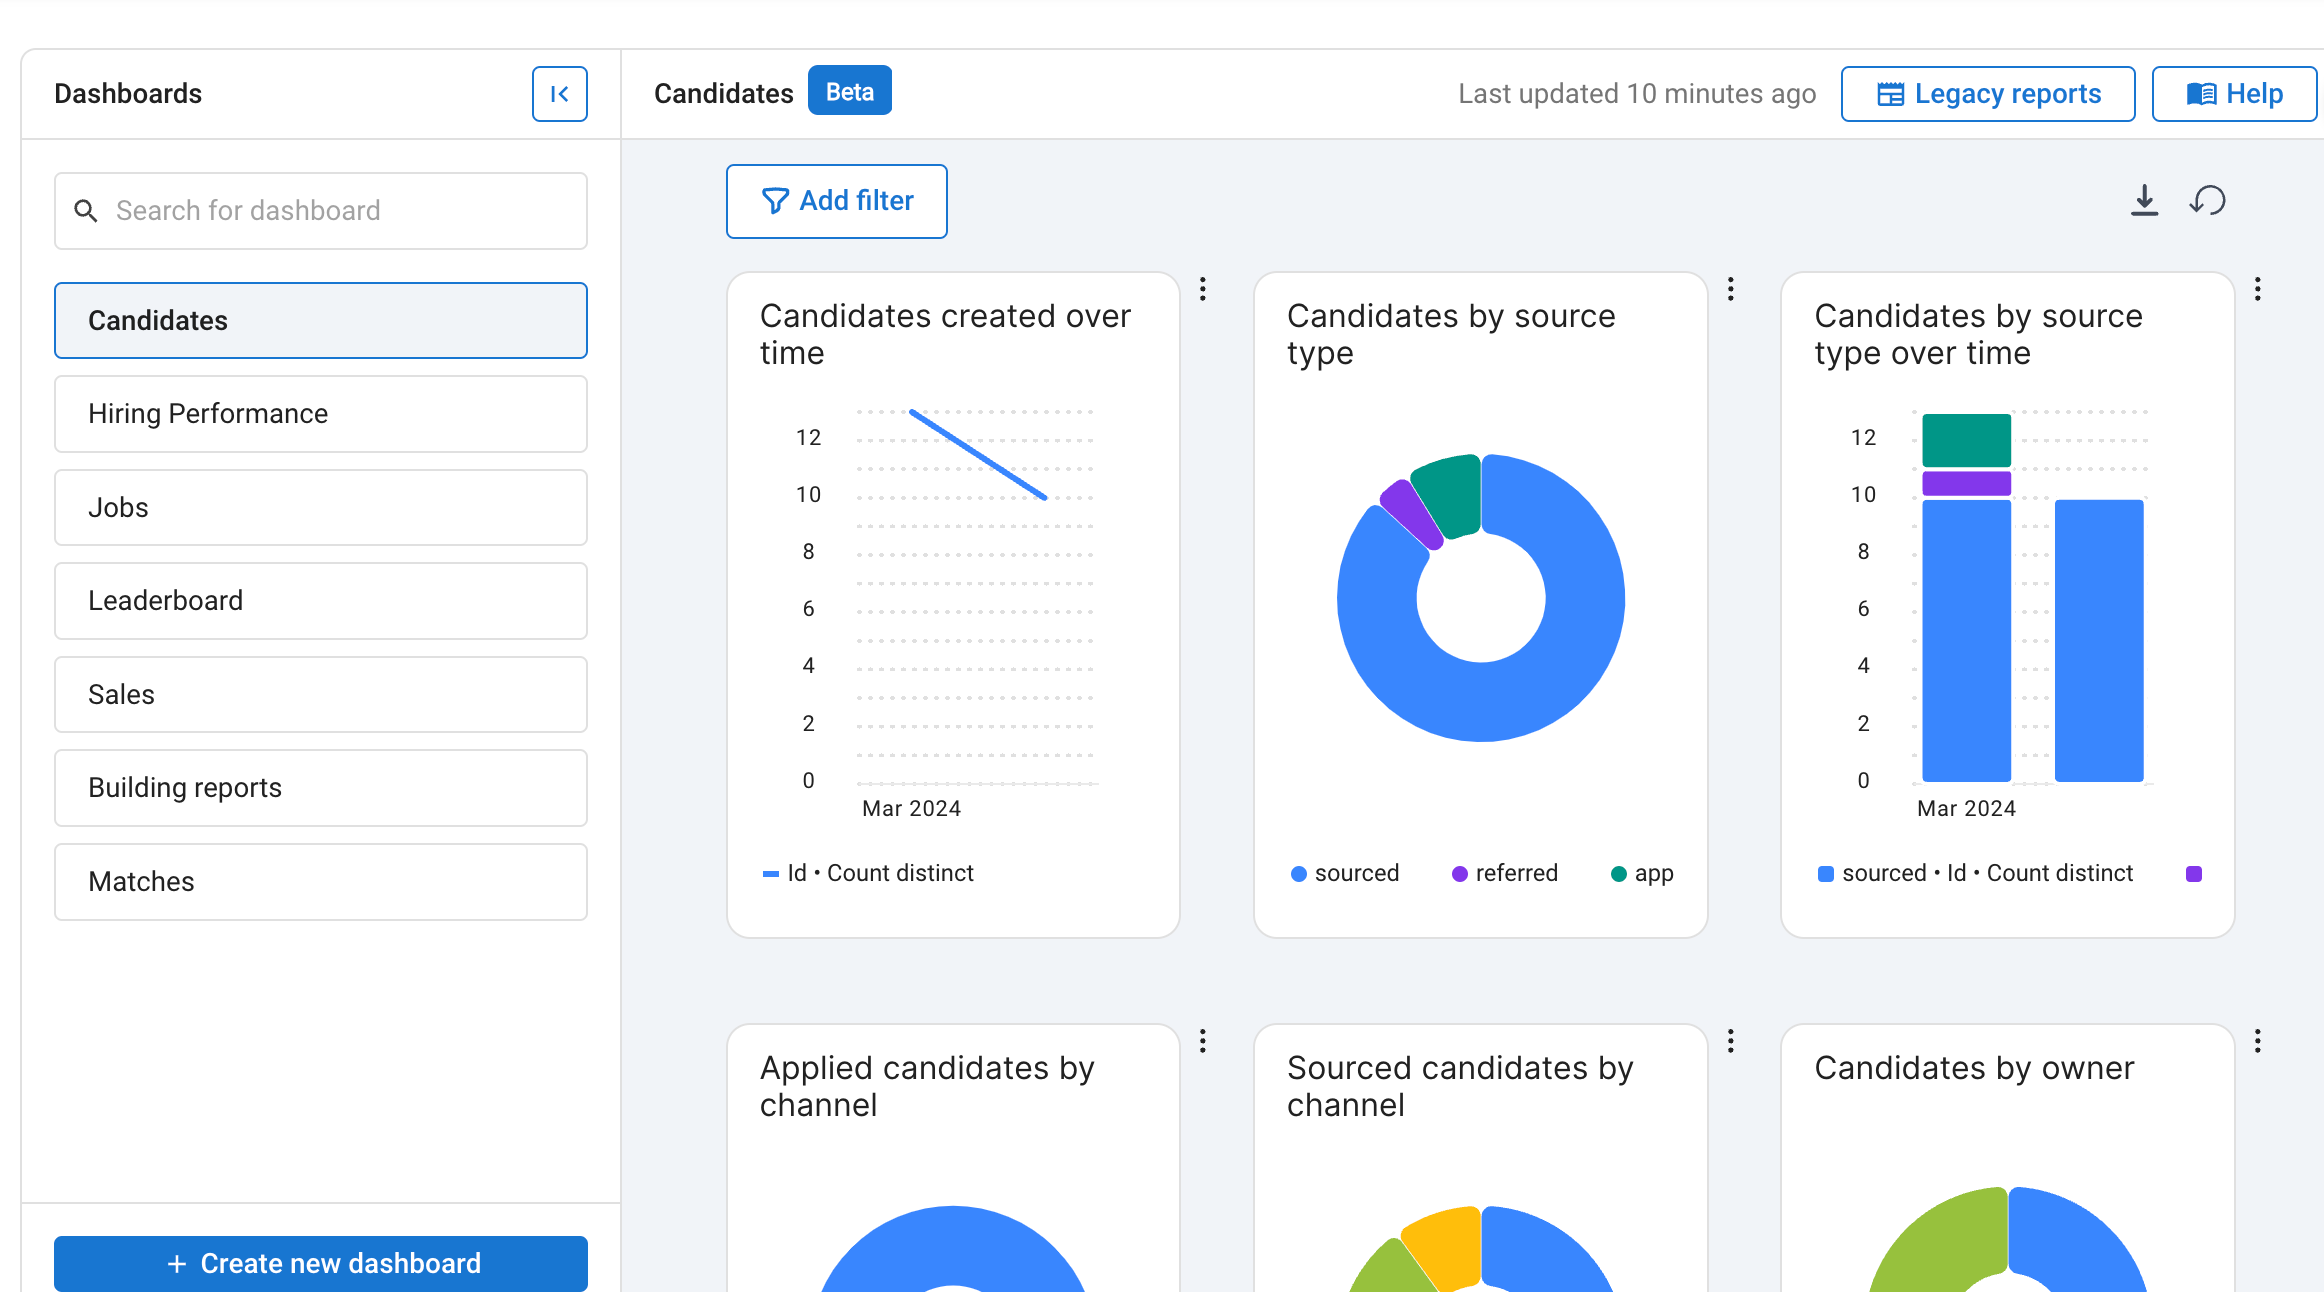
Standard reports force you into rigid views, making it difficult to isolate specific hiring metrics or tailor insights for different stakeholders. Tracking your recruitment progress could slow down when your key performance indicators (KPIs) are buried in clutter.
With Advanced Reports’ customizable dashboards, you can structure your recruitment data to match your exact workflows.
Here is how you can customize your reporting interface:
- Organize data by process or team member: Create multiple distinct dashboards to separate metrics for specific recruitment stages, departments, or individual team members.
- Tailor your dashboard layout: Adjust the width and height of individual cells and rows using simple drag-and-drop controls to highlight your most critical data.
Pre-defined Libraries vs. Custom Building
While organizing your dashboard solves the clutter, teams often still run into rigid, standard reports that can't answer unique, specific hiring questions. Manatal's Advanced Reports feature bridges this gap by giving you complete control over how you generate data, allowing you to choose between ready-to-use templates and fully custom configurations.
- Select from the Library: Access a variety of pre-defined reports in the form of charts, tables, and metrics directly from the report library.
- Build Your Own: Create tailored reports using the custom report builder tool by choosing your Metric (what to measure, like candidate count), Grouping (how to split the data, like created month), and Filter (limiting data under Advanced Options, like recruiter name).
Key Reports to Supercharge Your Hiring
Standard, off-the-shelf templates rarely fit every recruitment workflow, industry KPI, or team objective. Relying solely on rigid reports leaves teams blind to critical pipeline bottlenecks, recruiter activity levels, and financial outcomes. To eliminate these blind spots, you can build custom, data-driven reports tailored to your exact tracking, visualization, and hiring needs.
Here are four essential custom report types you can build to optimize your recruitment strategy:
1. "Time To" Reports
In recruitment, speed matters; unaddressed pipeline delays lead to candidate drop-off and increased costs. "Time To" reports help you pinpoint bottlenecks across your workflow, such as how long it takes to submit candidates or fill a position, so that you can streamline operations.
- Average Time to Fill per Organization: Measures the average time in days required to fill a role per client or organization using the
Matchesdataset (Hired atminusJob Created at), visualized as a Horizontal Bar Chart or a Single Stat KPI. - Average Time to Submit Candidates per Job: Measures how quickly candidates are submitted to clients (
Submitted atminusJob Created at) grouped byJob Nameusing a Horizontal Bar Chart. - Average Time in Stage: Tracks candidate dwell time across pipeline stages (
Next moved atminusMoved at) using theMatch Historydataset, built as a Pivot Table or Stacked Horizontal Bar Chart. - How to Build a "Time To" Report: Under Advanced Options, select Date Difference, choose your two dates (e.g.,
Hired atandJob Created at), set the unit to Days, select your chart type and grouping variable, and add custom labels before saving.
2. Goals-Oriented Reports
Without clear visibility into target benchmarks, recruitment teams risk drifting off-target with job creation, candidate sourcing, or active listings. These reports keep your team aligned with company milestones by comparing live hiring metrics directly against defined targets.
- How to Build a Goals-Oriented Report: Select your dataset (e.g.,
Jobs), choose the Progress chart type, pick your metric (e.g.,ID - Uniqueto count jobs), set your target goal (e.g., 50 jobs), and choose between a Linear or Circular layout.
3. Revenue Tracking Reports
Without dedicated financial reporting, agency leaders and hiring managers struggle to measure the monetary ROI of placement efforts or identify top-performing clients. Revenue reports connect placement data directly to financial outcomes to monitor performance and prioritize high-value accounts.
- Total Revenue Generated: Uses the
Revenuesdataset with a Single Stat view (Amount in Sum) to provide an immediate KPI of total placement revenue. - Revenue Generated vs Target: Uses a Progress Chart (Linear or Circular) on the
Revenuesdataset with a target goal (e.g., $50,000) to keep teams motivated. - Revenue Growth Over Time: Uses a Line Chart grouped monthly by
Accounted at(sorted ascending) to visually spot seasonal trends and revenue evolution over time. - Revenue by Client: Groups revenue by account to help teams identify high-value clients and discover upsell opportunities.
4. Sales Activity Reports
Unclear activity history leads to missed follow-ups, fragmented client communication, and a lack of team accountability. Sales activity reports document every candidate and client touchpoint—tasks, calls, meetings, emails, and interviews—giving management full visibility over recruiter output.
- How to Build an Activity Report: Create a new report using the Activities dataset, select the Pivot Table view, group columns monthly by
Created at, group rows by activityType, set the metric toObject name(Count), and sort chronologically.
Fine-Tune and Share Your Insights
Finding the data is only the first step; analyzing and sharing it is where the real value lies. Manatal equips you with dynamic filtering and exporting capabilities.
Global and Local Filters
- A global filter allows you to filter data across all reports in a dashboard at once, while a local filter applies to a specific report.
- Filters can be easily created by selecting the datasets, filter types, and specific fields.
Exporting Data
- Manatal allows you to export both individual reports and entire dashboards.
- When exporting a report, you can download the full dataset (up to 10,000 rows of underlying data), the view dataset, or download the report as a PNG image.
- To export an entire dashboard, you simply choose your preferred orientation (portrait or landscape) and download it as a PDF.
Ready to unlock your data?
Stop guessing and start optimizing. Start a 14-day free trial and get access to our advanced reporting suite today >>
.webp)







.webp)

.webp)


.webp)


