





A senior role opens, and the pipeline is empty. By the time you post the job and wait for applicants, the strongest candidates have already taken other offers. Market mapping in recruitment prevents this: it builds the talent picture before the requisition exists, so you start each search with a researched, contactable shortlist.
What Is Market Mapping in Recruitment?
Market mapping is a proactive research process that charts external talent before a role opens, covering competitor organization structures, reporting lines, compensation bands, and passive candidates. Market mapping in recruitment shows how the market is structured so you can plan a search instead of reacting. It also serves as competitive intelligence, showing where rivals are growing and helping you advise clients on realistic titles and pay.
- Fills critical seats: Replaces posting and praying with an existing research base, addressing the 69% of organizations that report difficulty filling full-time roles, as per the SHRM 2025 Talent Trends report.[1]
- Protects hiring quality: Gives you a pre-warmed, vetted pipeline rather than rushing to hire whoever is available, tackling the issue where 66% of managers say recent hires were not fully prepared, according to Deloitte 2025 Global Human Capital Trends.[2]
- Sharpens pitch: Uses real-time rival intelligence to help you frame roles honestly and position offers effectively against competitors.
Market Mapping vs. Talent Mapping vs. Sourcing
These three terms overlap, and mixing them up wastes effort. Here is how they differ.
Agencies often run all three and store the output in a recruitment CRM so client-facing pipeline stays in one place.
Choose by timing. Market mapping fits early planning and executive or retained search, before a requisition exists. Talent mapping and sourcing take over once you know the specific role and need people to contact.
Types of Market Mapping in Recruitment
Market mapping comes in four main types, grouped by purpose. Most recruiters blend two or three on a single project.
- Talent or function-based mapping: Maps people by role, skill, compensation band, and location for complex or senior searches.
- Competitor and company mapping: Maps competitor organization structures, leaders, and where their best talent currently sits.
- Perceptual or positional mapping: Plots how employers compare (startup vs enterprise, team size vs revenue) to reset client expectations.
- Pipeline or BD mapping: Maps target client companies, growth signals, and decision-makers for agency business development.
In-house teams lean on talent and competitor mapping to plan future hires and benchmark rivals. Agencies add pipeline mapping to win new clients and spot growth signals early. The type you emphasize follows the outcome you are paid for.
How to Do Market Mapping in Recruitment
Starting every search from scratch increases time-to-fill and leaves hiring teams reactive. Following a structured market mapping workflow enables talent teams to systematically chart candidate landscapes, target passive talent, and build reusable talent pipelines.
1. Define Scope and Write a One-Line Brief
Vague search parameters waste sourcing capacity and yield broad, irrelevant talent lists. Establishing tight search boundaries ensures every company and profile mapped directly matches the core requirements of the role.
How to Run It: Fix geography, seniority, industry, company size, and function into a single reference line (e.g., "Director+ data roles in B2B SaaS, 200-1,000 employees, backed by Tier-1 VCs"). Share this brief with stakeholders before initiating research.
2. Build the Company Universe
Focusing on individual candidates before mapping target employers leads to missed talent pockets. Defining target and adjacent companies first provides the structural foundation needed for systematic candidate discovery.
How to Run It: Use LinkedIn Sales Navigator and Crunchbase to list target and adjacent firms. Capture headcount trends and funding signals, then tag each company A, B, or C based on strategic fit.
3. Map Organizational Structures
Relying solely on job titles often misses qualified candidates due to inconsistent industry naming conventions. Reconstructing team hierarchies reveals reporting lines, team sizes, and exact talent density across target competitors.
How to Run It: Search by department and title variants in LinkedIn Recruiter to map reporting lines, team sizes, and recent hires. Log organizational hierarchies to identify key decision-makers and direct reports.
4. Identify and Tag Candidate Profiles
Unstructured candidate research slows down future sourcing and creates manual data entry bottlenecks. Logging structured candidate records directly into your database turns raw search results into an actionable pipeline.
How to Run It: Search profiles by title, skills, tenure, and location. Tag each candidate by role type, seniority, domain, and priority in your database.
Tap into Manatal’s Sourcing Hub to access a global external database of over 700 million professional profiles. Automate profile discovery and import tagged, de-duplicated candidate records directly into your ATS pipeline to eliminate manual data entry.
{{cta}}
5. Layer in Compensation and Mobility Data
Reaching out to candidates without understanding market rates risks severe drop-off late in the hiring process. Integrating real-time compensation and movement trends ensures offer expectations alignment from day one.
How to Run It: Benchmark compensation bands per level using Glassdoor and Payscale. Overlay talent hotspots and historical movement patterns for top performers onto your target company list.
6. Run the Human Checkpoint
Unverified market data wastes outreach efforts and damages employer brand reputation. Executing a strict review step ensures candidate data, current roles, and assumptions are accurate before launch.
How to Run It: Have a recruiter manually validate profile accuracy, confirm compensation and title assumptions, and clear duplicate records prior to starting any outreach campaign.
7. Engage and Nurture by Segment
Generic mass outreach yields low response rates from high-demand passive talent. Segmenting messaging around market insights and candidate career triggers drives higher engagement.
How to Run It: Build tailored outreach messaging incorporating salary and industry insights for each candidate segment. Set up automated triggers in your ATS to re-engage prospective candidates when they change roles.
8. Turn the Map Into a Reusable Asset
Market mapping loses value if research sits isolated in static spreadsheets. Converting research into a centralized talent asset ensures ongoing pipeline efficiency across future hiring cycles.
How to Run It: Consolidate data into a standardized deliverable covering target companies, key profiles, and compensation insights. Maintain candidate shortlists directly inside your ATS on a regular refresh cadence.
A Worked Market Map Example
Here is a filled mini-map for one niche role, Director of Data Engineering in US B2B SaaS:
- Company universe: 18 Series B to D SaaS firms, 200-1,000 employees, tagged 6 A, 8 B, and 4 C.
- Organizational structure: Data teams of 15 to 40 people, led by a VP or Director reporting to the CTO.
- Talent pool: 42 directors and senior managers tagged by domain, warmth, and priority.
- Compensation: Base compensation bands gathered from Glassdoor and Payscale, plus equity ranges by stage.
- Coverage: 80% of in-ICP companies mapped, with 12 warm, contactable candidates in the ATS.

A map like this pays off on handoff. When the Director role opens, the recruiter already has vetted people, compensation expectations, and a company shortlist, so the search starts mid-stream. The same map also seeds the next searches in that niche. To build a similar asset for your own searches, download the niche role market mapping dashboard template and adapt it to your hiring needs.
How to Measure Market Mapping ROI (Key KPIs)
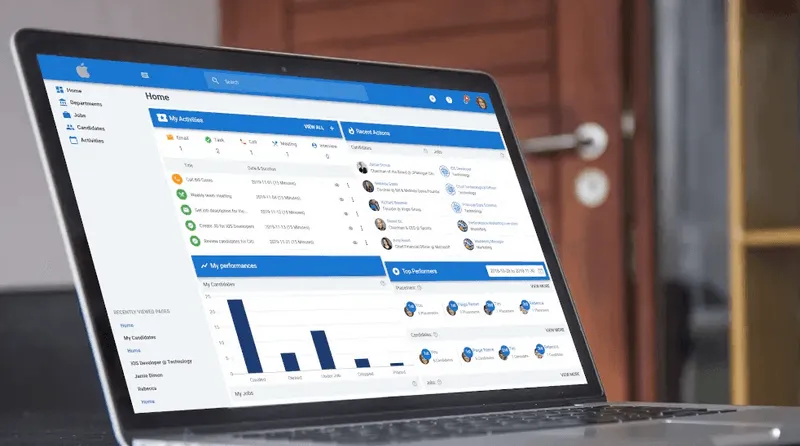
Track market mapping like any pipeline investment, using Manatal’s reporting and analytics to see whether the map produces.
- Time-to-shortlist and time-to-first-submit: how fast a warm shortlist appears once a role opens.
- Mapped candidates per priority role and mapped companies per ICP segment.
- Coverage against the target, for example, the share of in-ICP companies fully mapped.
- Conversion by segment across outreach response, shortlist, and offer.
Set an early target such as a 20-30% cut in time-to-shortlist once your first maps mature and pipeline starts to compound.
Review these KPIs by segment, not only in aggregate. A map can look complete overall while a priority ICP segment stays thin. Segment-level coverage tells you where to keep researching before a client role lands.
Common Mistakes to Avoid
- Mapping people before companies, which produces names with no market context.
- Treating a name list as a map, when a map needs org structures and market dynamics.
- Letting the map go stale with no owner or refresh cadence.
- Storing candidate data without a documented legal basis, a critical compliance requirement under GDPR (EU).
Mapped data is still personal data. Keep a lawful basis for storage, document where each profile came from, and honor deletion requests, especially under state privacy laws like the CCPA. A short processing note on each ATS record keeps the map audit-ready and easy to hand off.
Conclusion
A market map only pays off once it becomes a live, contactable, de-duplicated pool in your system of record. Research that sits in spreadsheets and saved searches goes stale and gets rebuilt for every req. Keep mapping, enrichment, and outreach in one platform, and the map compounds over time. Manatal keeps your market map live: source from a 700M+ database, capture and tag profiles in one ATS, and work the shortlist without switching tools.
Frequently Asked Questions
Q: Why do recruiters use market mapping?
A: Recruiters use market mapping to hire proactively instead of reactively. It builds a researched view of target companies and passive candidates, which shortens time-to-shortlist and protects quality of hire. It also becomes a reusable asset the team refreshes rather than rebuilds for every requisition.
Q: How long does a market mapping project take?
A: A focused map takes a few weeks, while a broad or senior search can run a couple of months. Timing depends on niche size, seniority, and how much of the research your tools automate.
Q: What tools do recruiters use for market mapping?
A: Most stacks combine LinkedIn Recruiter or Sales Navigator for people and company data, Crunchbase for funding signals, and comp sources like Glassdoor and Payscale. An ATS or CRM stores the map as a tagged, de-duplicated pool. Manatal's Sourcing Hub adds a 700M+ profile database with direct capture into the ATS.
Q: What is the difference between market mapping and talent mapping?
A: Market mapping charts the wider market: companies, org structures, comp bands, and talent density. Talent mapping zooms into specific people, their skills, seniority, and readiness to move. Most recruiters run market mapping first, then talent-map the priority segments it reveals.
Q: What is an example of market mapping in recruitment?
A: A fintech agency mapping compliance leaders would first list target banks and startups. It would chart their risk and compliance org charts, tag directors by seniority and warmth, add comp bands, and load the shortlist into its ATS. The result is a ready pipeline the moment a client opens a role.
Citations
.webp)







.webp)

.webp)


.webp)


