


Without a dedicated dashboard to track meaningful recruitment KPIs, your entire talent acquisition strategy relies on guesswork rather than data. These indicators provide the necessary clarity to evaluate your team’s performance and optimize your recruitment pipeline. This article identifies the essential metrics you need to transform your hiring process into a predictable and efficient operation.
Recruitment KPI vs. Recruitment Metric
Before we dive into the details of setting up recruitment KPIs, let’s clarify the difference between recruitment KPIs and metrics.
- Recruitment Metrics: These are raw quantitative measurements used to track specific recruitment activities and trends. They provide data points such as the total number of applicants or cost per hire without indicating success or failure.
- Recruitment KPI: Strategic indicators directly linked to your organizational goals and performance targets. They measure the effectiveness of your process by comparing actual results against predefined benchmarks or targets.
This comparison table summarizes the fundamental differences to help you organize your reporting structure.
Building Your Recruitment KPI Dashboard
To transform abstract metrics into a functional tool, you must construct a structured database. Open a blank Excel workbook or Google Spreadsheet and follow these exact steps to build an automated tracking system.
Step 1: Create the Database Structure
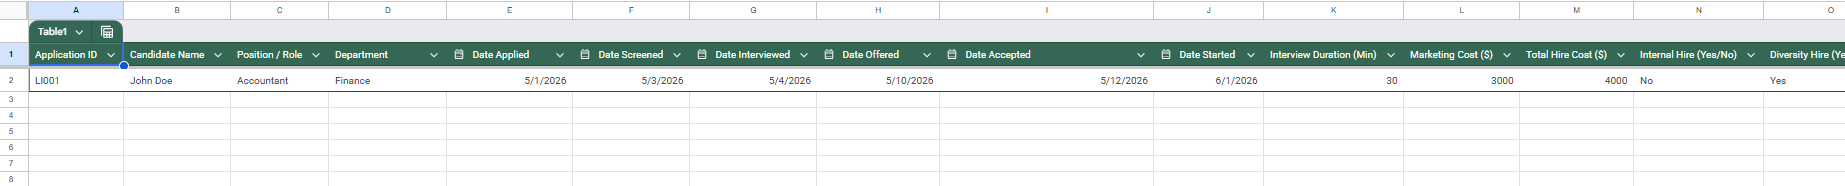
Create two tabs at the bottom of your workbook. Name the first tab "Raw Data" and the second tab "KPI Dashboard". The "Raw Data" tab will serve as your master ledger.
Type the following exact headers into row 1 of your "Raw Data" tab, moving from column A to R.
Download this template >>
Step 2: Implement the KPI Formulas
Navigate to your "KPI Dashboard" tab. This page will automatically read the information from your "Raw Data" tab. Create a table with headers for KPI Group, Criteria, Unit, Target, and Actual. Copy these Excel formulas into the "Actual" column (Column E) to generate your real-time metrics:
- Time to Fill (Days): =AVERAGE('Raw Data'!J:J - 'Raw Data'!E:E)
- Time to Hire (Days): =AVERAGE('Raw Data'!J:J - 'Raw Data'!F:F)
- Selection Rate (%): =COUNTIF('Raw Data'!J:J, "<>") / COUNTA('Raw Data'!A:A)
- Offer Acceptance Rate (%): =COUNTIF('Raw Data'!I:I, "<>") / COUNTIF('Raw Data'!H:H, "<>")
- Cost per Hire ($): =SUM('Raw Data'!M:M) / COUNTIF('Raw Data'!J:J, "<>")
- Diversity Hire Rate (%): =COUNTIF('Raw Data'!O:O, "Yes") / COUNTIF('Raw Data'!J:J, "<>")
- Hiring Manager Satisfaction (Points): =AVERAGE('Raw Data'!R:R)
Step 3: Setup Performance Indexing & Visuals
To calculate the "Act vs Target Index" (Column F) as seen in the template, use the following logic to ensure "higher is better" and "lower is better" KPIs are handled correctly:
- For Speed/Cost (Lower is better, e.g., Time to Fill): =(Target / Actual) * 100
- For Quality/Success (Higher is better, e.g., Diversity Rate): =(Actual / Target) * 100
Conditional Formatting:
- Highlight the Index cells.
- Go to Conditional Formatting > Icon Sets.
- Select the 3 Traffic Lights (Unrimmed).
- Set rules: Green if value >= 100, Yellow if value >= 80, Red if value < 80.
Step 4: Design & Polish
- Color Palette: Use a dark slate (#2F3E46) for the header bar and a light grey background (#F4F4F4) for the dashboard body.
- Gridlines: Turn off gridlines (View > Uncheck Gridlines) to give it a clean, software-like feel.
- Frozen Panes: Freeze the top rows of the "Raw Data" tab so your headers stay visible as you add hundreds of candidates.
Step 5: Execute Your Weekly Tracking Cadence
A dashboard is only as reliable as its latest data entry. Block out 30 minutes on your calendar every Friday afternoon to execute this exact maintenance routine:
- Export the latest data: Download the weekly applicant activity report from your job boards or email folders as a CSV file.
- Paste new entries: Copy the new candidate information and paste it directly into the next available empty row on your "Raw Data" tab.
- Update pipeline movements: Locate the rows for active candidates you interviewed or hired this week. Type the exact dates into the "Interview Date", "Offer Extended Date", and "Offer Accepted Date" columns.
- Log new expenses: Type any new advertising spend or agency fees into the "External Costs" column for the respective roles.
- Verify the dashboard: Click over to the "KPI Dashboard" tab to ensure the formulas have captured the new data points.
- Distribute the results: Copy the calculated metrics from the dashboard tab and email them directly to your hiring managers to highlight the week's performance.
Manual spreadsheets demand rigid discipline and advanced formula management to prevent data corruption. However, with Manatal’s Reports and Analytics tool, it automatically tracks every candidate interaction and generates a visual, real-time recruitment dashboard without requiring a single manual formula or data entry task on your end.
{{cta}}
Recruitment KPIs You Should Track and How to Measure Them
Now that you know how to set up your recruitment KPI dashboard, let’s look at some of the most important ones that you should have and how to measure them.
The average number of days from a candidate’s first recorded entry into the process to offer acceptance.
Formula: (Total days to hire for all candidates) / (Total number of hires)
Why it matters: Highlights bottlenecks in your screening stages and prevents top talent from dropping out due to procedural delays.
The average financial investment required to source, recruit, and onboard a new employee.
Formula: (Total Internal Recruiting Costs + Total External Recruiting Costs) / (Total Number of Hires)
Why it matters: Controls your recruitment budget and determines the financial return on your talent acquisition tools and agencies.
Quality of Hire
The tangible value and performance a new employee contributes to your organization.
Formula: (Performance Score + Ramp-up Time Score + Retention Score) / (Number of Variables Tracked)
Why it matters: Ensures your screening processes identify candidates who align with your organizational goals and possess the necessary competencies.
The percentage of extended job offers that candidates formally accept.
Formula: (Number of Accepted Offers / Number of Extended Offers) * 100
Why it matters: Reveals the market competitiveness of your compensation packages and the strength of your employer value proposition.
Diversity of Hire
The demographic composition of new hires across legally reportable categories your organization is permitted to collect.
Formula: (Number of Hires from a Specific Demographic / Total Number of Hires) * 100
Why it matters: Tracks progress toward your corporate inclusion initiatives and ensures equitable hiring practices across your organization.
Candidate Satisfaction
The quantifiable level of approval candidates report regarding their experience in your hiring funnel.
Formula: (Total Sum of Candidate Survey Scores) / (Total Number of Survey Responses)
Why it matters: Protects your public employer brand and influences whether candidates will reapply or refer their peers in the future.
The specific origin channel or platform that successfully produces a hired candidate.
Formula: (Number of Hires from a Specific Source / Total Number of Hires) * 100
Why it matters: Directs your advertising spend toward the most lucrative platforms and eliminates wasted budget on underperforming job boards.
The total calendar days required to fill an open requisition, starting from initial HR approval until the candidate signs the offer.
Formula: (Total days from job requisition approval to offer acceptance for all roles) / (Total number of filled roles)
Why it matters: Sets realistic expectations with hiring managers regarding empty seats and informs broader business continuity planning.
First-Year Attrition Rate
The percentage of newly hired employees who depart your organization within their first twelve months.
Formula: (Number of Hires Who Leave Within One Year / Total Number of Hires Over That Same Period) * 100
Why it matters: Exposes poor alignments between job descriptions and actual daily duties or highlights failures within your onboarding program.
Factors That Influence Recruitment KPI Selection
Several variables determine which indicators are most relevant to your specific strategy. Focus on these three areas to ensure your data remains actionable:
- Organizational Scale: Your company’s size and mission shape which hiring outcomes matter most. In SHRM’s 2025 Benchmarking Reports, only 20% of organizations track quality of hire, and average cost per hire is $5,475 for nonexecutive roles and $35,879 for executive roles.[1]
- Market Dynamics: Competition for talent shifts tracking priorities toward skills and retention. In WEF’s 2026 report on AI and workforce planning, skills matching and opportunity matching are linked to improved retention, about a 30% reduction in time to fill, and about a 21% increase in the quality of recruits.[2]
- Funnel Stage: Your metrics must change as candidates move through the pipeline. Sourcing focuses on channel effectiveness and lead volume, while the final hiring stage requires analysis of offer acceptance rates to identify procedural friction.
Conclusion
Transitioning from intuitive hiring to a data-driven strategy is necessary for maintaining a competitive edge in today's talent market. You must move beyond raw metrics and focus on KPIs that align directly with your organizational objectives to ensure every recruitment dollar delivers value. While manual tracking provides an initial foundation for your data, automated solutions like Manatal eliminate the risk of human error and allow your team to focus entirely on candidate engagement. Implementing these indicators transforms your recruitment pipeline into a predictable and efficient engine for growth. Consistent analysis of your recruitment KPI dashboard provides the clarity needed to refine your tactics and secure the high-quality talent your organization requires.
Frequently Asked Questions
Q: How do I choose the right recruitment KPI for my organization?
A: Choose KPIs that align with your hiring goals, business priorities, and the stage of your recruitment process you need to improve. If your priority is speed, focus on time to hire and time to fill; if cost control matters more, track cost per hire; if quality is the main concern, measure quality of hire, offer acceptance rate, and first-year attrition. The most useful KPIs are the ones your team can act on consistently.
Q: How many recruitment KPI should I have?
A: Use a small set of core KPIs rather than tracking everything at once. A practical dashboard usually includes five to seven primary indicators, with a few supporting metrics underneath them. Too many KPIs make reporting harder to read and weaken accountability, while a focused set keeps attention on the metrics that affect hiring decisions.
Q: How do I measure and calculate my recruitment KPI?
A: Collect clean source data for every stage of the hiring process, then apply the same formulas each week or month so the numbers stay consistent. Use definitions that do not change over time, such as time to hire, cost per hire, offer acceptance rate, and source of hire, and make sure each metric uses the same date fields, status fields, and cost inputs across the team. Manatal’s Reports and Analytics can automate much of this tracking with live dashboards and ready-made reporting views.
Q: How do I monitor and report my recruitment KPIs?
A: Review your KPI dashboard on a fixed cadence, usually weekly for operational metrics and monthly for strategic reporting. Compare current results against previous periods, flag any stage where performance drops, and share the findings with hiring managers and leadership in a clear format that shows trends, gaps, and next actions. Manatal’s Reports and Analytics supports this process with visual dashboards and performance reporting that reduces manual tracking.
Citations:
.webp)


.webp)


.webp)